
Only 42% of London Homes Are Selling. Here's What That Means for Agents in North London
Only 42% of London homes that come to market find a buyer, according to Rightmove's October data, down from 74% in 2021. Homes for sale are at their highest level for the time of year since 2014, buyer enquiries are down 9% on last year, and London prices fell 2.2% in the year to August, the weakest of any English region (HM Land Registry). Central London is falling hardest. North London is split: Camden is down 10.6%, while Enfield is up 0.8%.
Updated 29 October 2026 with August Land Registry data, Rightmove's October index and the Budget outcome. For what the Budget means for new builds, see Your First Home in London: the price caps by borough.
In a market like this, two things decide which listings sell: price and presentation. Price is the agent's call. Presentation is ours. We have photographed and filmed London homes for more than ten years, and the second half of this report covers what the listings that sell are doing differently.
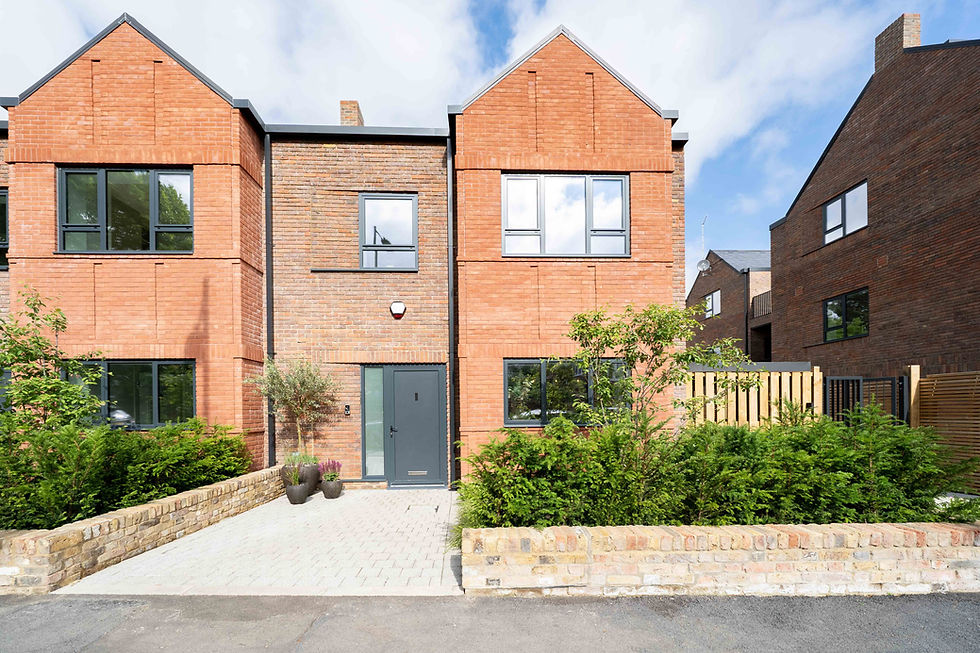
Hampstead Extension, NW11. A recent RADcreator shoot.
Why are so few London homes selling?
Too many homes, not enough buyers, and expensive borrowing. Rightmove's October figures:
Homes for sale are at their highest level for the time of year since 2014.
Buyer enquiries are 9% lower than a year ago, and sales agreed are 8% lower.
In London, homes take 78 days on average to find a buyer, and 38% of listings have had a price cut.
The average two-year fixed mortgage is 5.55%, up from 4.25% before the war in Iran began. That adds around £250 a month to a new mortgage.
The Bank of England held Bank Rate at 3.75% on 17 September, but three of the nine committee members voted to raise it, and markets now expect a rise on 5 November. Buyers have choice and no reason to rush, so a listing that launches overpriced or underwhelming gets scrolled past.
Which parts of north and central London are falling fastest?
The most expensive boroughs. Camden is the weakest in north London on both sold and asking prices. Enfield is the strongest.
Borough | Avg sold price, Aug 2026 | Annual change (sold) | Annual change (asking, Oct) |
Westminster | £887,206 | -14.3% | -3.5% |
Kensington and Chelsea | £1,204,072 | -13.8% | -4.8% |
Camden | £798,486 | -10.6% | -7.8% |
Islington | £654,286 | -8.6% | -4.9% |
Barnet | £592,892 | -4.4% | -3.5% |
Hackney | £619,408 | -1.6% | +0.4% |
Brent | £555,687 | -0.3% | -4.2% |
Haringey | £633,221 | -1.4% | -1.5% |
Enfield | £474,855 | +0.8% | +1.3% |
Sold prices: HM Land Registry UK House Price Index, August 2026. Asking prices: Rightmove House Price Index, October 2026 (three-month rolling borough averages).
A caveat. Land Registry figures are completed sales, so they lag the market by a few months, and borough figures swing on small samples. Westminster's 14.3% fall is real in direction but probably overstated by the mix of homes that happened to sell. LonRes, which tracks achieved prices per square foot in prime areas, puts the prime central London fall at 6.5% for July to September.
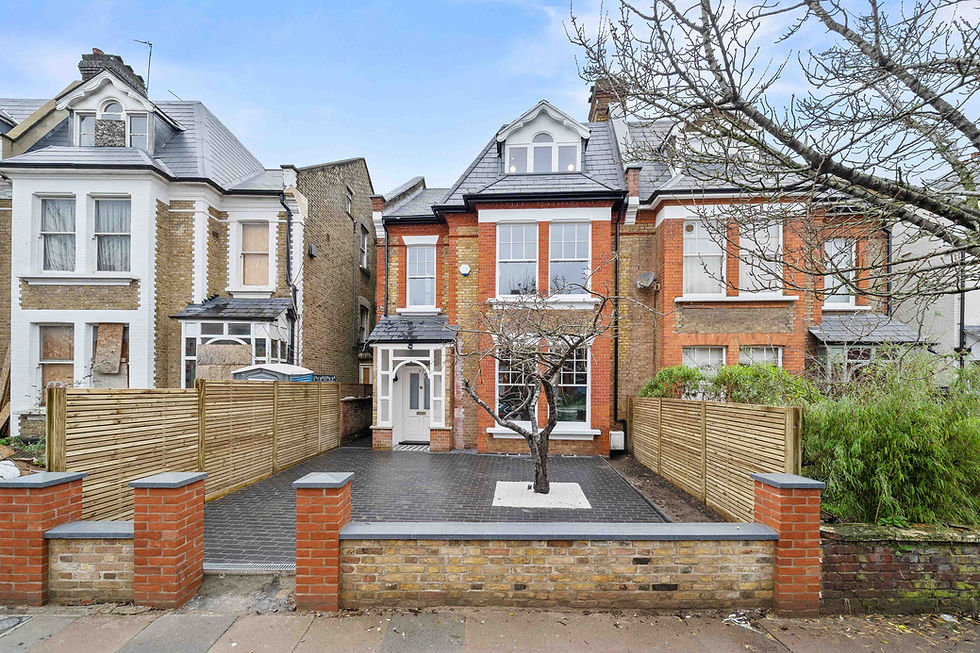
Dyne Road, NW6. Shot for a north London agent.
Why is Camden down while Enfield is up?
Expensive boroughs are falling furthest. Three of London's five priciest boroughs are down more than 10% over the year. Enfield (£474,855) sits well below Camden (£798,486), and Haringey (£633,221), which led north London in our previous update, has slipped to a 1.4% fall.
Flats are weaker than houses. In London, flat prices fell 5.0% in the year to August while house prices rose (HM Land Registry). Buying agency Black Brick sees the same: family houses in good areas still get competitive bids, apartments are a harder sell.
Tax is weighing on the top end. The 28 October Budget confirmed that from April 2028, owners of homes worth £2m or more will pay a council tax surcharge of £2,500 to £7,500 a year. The OBR expects that cost to be absorbed through lower prices.
So a Camden flat and an Enfield family house are in different markets this autumn. They need different launches.
Is prime central London turning?
Maybe, but buyers still set the terms. Knight Frank recorded a 0.3% rise in prime central London prices in the three months to September, the first quarterly increase in four years. But LonRes found prime sellers accepted an average of 10.4% below asking in the first half of 2026 (13% above £5m), and homes took 186 days to sell.
North London's prime pockets are holding up better. Benham and Reeves puts Islington third in London for demand on £2m to £10m homes, with 37.2% sold subject to contract in Q3.
High End Property Photography: When buyers are negotiating 10% off, the photos have to justify the asking price. See high-end work →
What do the listings that sell get right?
Rightmove's own answer is short: realistic pricing or a high-quality finish. It found 74% of homes sold this year were priced right first time and never needed a reduction. Pricing is the agent's job. Here is what we see on the presentation side.
1. They launch finished
A listing gets its biggest burst of attention in the first week. Going live with phone photos and "video to follow" wastes it. We usually turn photos around within 24 hours, so there's no reason to launch half-done.
2. The photos match the room
Weak London listing photos fail the same way: blown-out windows, dark corners, leaning walls. We shoot bracketed exposures and blend them, so the window keeps its view and the verticals stay straight. With upfront sales packs coming under the government's homebuying reforms, accurate images protect the agent as well as the sale.
3. Every listing has a floor plan
Buyers comparing dozens of similar flats shortlist on the floor plan. Ours is included in every photography package.
Property Photography, London: Blended interiors, straight verticals, floor plan included. Usually back within 24 hours. From £125. Book a shoot →
4. Video does the first viewing
With fewer buyers about, the goal is getting the right ones through the door. A walkthrough lets them judge layout and light before booking, and agents have told Rightmove that sending a video means fewer wasted viewings. We shoot vertical tours for Instagram and TikTok (from £100) and cinematic tours for the portals and YouTube (from £250). Here's how north London agents are using both.
Property Video Tours: Vertical tours for social from £100. Cinematic walkthroughs from £250. See video tours →
5. Aerial where it adds something
For north London houses with big gardens or near the Heath, Alexandra Park or Trent Park, drone footage shows plot size and surroundings that ground photos can't. Much of central London has tight airspace restrictions, so we plan aerial case by case.
6. At £2m and up, they sell the finish
When prime buyers are pushing for 10% to 13% off, the marketing has to show why the price is right: the joinery, the stone, the light at the right time of day.

Hanover Road, NW10. More in our projects.
"Your photos will be taken professionally and at the highest quality. Ours are usually returned promptly within 24 hours." Hussein Madarbakus, Director, Lampards
What dates should agents watch next?
Date | What | Why it matters |
5 November | Bank of England rate decision | Markets expect a rise after three members voted for one in September |
18 November | Land Registry prices for September | Shows whether London's annual fall keeps narrowing |
February 2027 | Your First Home reservations open | First-time buyers return to London new builds, capped at £650k inner and £500k outer |
6 April 2027 | Landlord tax rise | Property income tax goes to 24%, 44% and 49% |
April 2028 | £2m+ council tax surcharge | Paid by owners, with a deferral scheme |
Frequently asked questions
What percentage of London homes sell?
Rightmove's October 2026 data shows only 42% of London homes that come to market find a buyer, the weakest of any region, down from 74% in 2021.
Are house prices falling in London in 2026?
Yes, on average. HM Land Registry shows London prices fell 2.2% in the year to August 2026, the weakest result of any English region, though the fall has narrowed from 3.2% in July.
Which north London borough is performing best?
Enfield. Sold prices rose 0.8% in the year to August (Land Registry) and asking prices were up 1.3% in October (Rightmove). Haringey, which led in our previous update, has slipped to a 1.4% fall.
Why are Camden house prices falling?
Camden's average sold price fell 10.6% to £798,486 in the year to August. It is a higher-value, flat-heavy market, which is where London prices are weakest, and the £2m+ council tax surcharge confirmed for April 2028 adds pressure at the top.
How long does it take to sell a house in London?
In London, homes take 78 days on average to find a buyer, according to Rightmove's October data. Prime London homes took an average of 186 days to sell in the first half of 2026 (LonRes).
Listing going live this autumn?
Photography from £125 with floor plan included. Video tours from £100. North and central London. Photos usually back within 24 hours.
For verified figures on how photos, video and floor plans affect listings, see our UK property marketing statistics for 2026. We update this report as new data comes out. Last updated 29 October 2026.
Sources
PrimeResi, Prime central London posts first quarterly price growth in four years (Knight Frank data)
Estate Agent Today, Buyer demand cools across much of prime London (Benham and Reeves)
Propertymark, Budget 2026 raises landlord taxes as new support targets first-time buyers
GOV.UK, Homebuying shake-up to slash delays, cut costs and stop sales falling through


Comments